
|
|
W. Dean Pesnell
Nomad Research, Inc.
Arnold, MD
During the 1960's Bodhan Paczynski, now a Professor of Astronomy at Princeton University, wrote a set of programs which compute the structure and lifetime of a star. This code became shareware, and the astronomical community has modified, improved, and used it for research and limited teaching applications ever since. The largest drawback has always been the massive tabular printout and its comprehension and interpretation.
The current modifications began in 1988 with graphics packages which would abstract parts of the tabular output and plot them first on pen plotters, then on the screen of a DOS machine. This was useful for research, but cumbersome for student use--there was more teaching about computers than about stars. By 1995, routines were available for screen graphics as an output mode from FORTRAN, and the code has been used several times in various astronomy and astrophysics classes at Northern Arizona University.
The four programs supplied here are each self-contained to run one of the programs in the Paczynski Code. A star with ten solar masses and made of 70% Hydrogen, 27% Helium has been chosen here for simplicity. Normally the user is allowed to choose the mass and composition. The programs require a 486 IBM Compatible or higher computer with MS DOS and SVGA graphics. We are currently working to make this set of programs available to college and university classes in general.
A. P. Odell
Dept. of Physics and Astronomy, Northern Arizona University,
Flagstaff AZ 86011
W. D. Pesnell
Nomad Research, Inc., Arnold, MD
Abstract
The output of stellar structure and evolution codes has traditionally been in enormous tabular form. We have extensively modified the public-domain Paczynski Code to provide real-time screen-graphical output for use in undergraduate and graduate college courses. Thus anyone studying the structure and evolution of stars can compute models of chosen mass and composition, and see the results (run of composition, energy generation, and gas properties with mass) presented visually as the evolution through core carbon burning proceeds. There are programs to generate gray stellar envelopes with mixing-length convection, converge homogeneous main-sequence models, integrate evolution sequences, and create summaries of model characteristics as a function of time, including a theoretical H-R diagram.
Introduction
During the 1960's Bohdan Paczynski, now a Professor of Astronomy at Princeton University, wrote a set of programs which compute the structure and lifetime of a star. This code became shareware (Paczynski, 1970), and the astronomical community has modified, improved, and used it for research and limited teaching applications ever since. The largest drawback has always been the comprehension and interpretation of the massive tabular printout.
Our current round of modifications began in 1988 with graphics packages which would abstract parts of the tabular output and plot them first on a pen plotter, then on the screen of a DOS machine. This was useful for research, but cumbersome for student use--there was more teaching about computers than about stars. By 1995, routines were available for screen graphics as an output mode from FORTRAN, and the code has been used several times in various astronomy and astrophysics classes at Northern Arizona University. The programs require a 486 or higher CPU with MS DOS and SVGA graphics. We are currently working to make this set of programs available to college and university classes in general.
The Programs
The first program in the suite (GOB), generates a gray stellar atmosphere assuming hydrostatic equilibrium and ideal gas law; energy transfer is by either radiation or mixing-length convection. Dissociation of molecular hydrogen and ionization of hydrogen and helium are computed. The user enters the mass of the star, the star's $\log L/L_{\sun}$, Teff, and mixing length.
The program first plots on the screen the run of temperature and density. Next it displays the fraction of molecular hydrogen (H2), neutral and ionized hydrogen (H I and H II), and the three states of helium ionization (HeI, HeII, and HeIII) at depth in the atmosphere. Third is the run of log \kappa (opacity in cm2 gm-1) with depth. Finally the adiabatic, radiative and the actual (mixing length) temperature gradients are displayed.
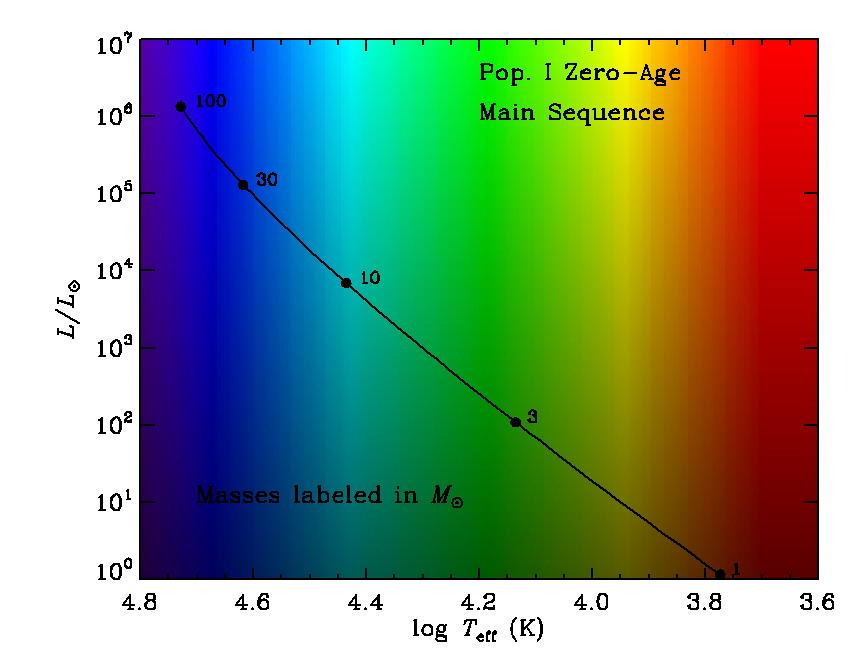
The second program in the Paczynski Code (SCH) generates a Zero Age Main Sequence model with homogeneous composition which has just started nuclear reactions of hydrogen to helium conversion in the core. Four boundary conditions must be guessed: log L/L\sun, log Teff, log Tc, and log \rhoc. The program uses the entered values as starting guesses for an outward numerical integration from the core to a fitting point (halfway out through the mass) and an inward integration of the envelope to the same fitting point. In general, inaccurate guesses lead to mis-match of conditions in the middle of the star. The program modifies these guesses and integrates again, converging a model.
The run of temperature, density, radius, and luminosity with distance from the stellar center are plotted for each of the steps in converging a model. Thus a student can see how the program "takes over" the guesses, and finds the properties of a star (what it would look like) without additional intervention. When the program terminates, a converged model is ready to be used as a startup for the next program; the derived conditions are independent of the initial guesses, and tell the properties of main sequence stars.
Program three (HB7) takes the output of SCH, changes the composition of hydrogen and helium according to the time step and local nuclear reaction rates, and converges an evolved star model. This process is repeated for as many time steps as the user has chosen, and can pick up wherever the program has left off.
The plots now show the same variables as for the SCH model (model 0), adding the mass fractions of hydrogen (X) and helium (Y) through the star. As the evolution proceeds, the convective core shrinks as hydrogen is depleted in the core, luminosity is used to expand the envelope, the convective envelope mixes nuclear-processed material to the surface, and carbon is produced in the core.
The final program (EDH) summarizes the results of HB7. Successive plots show the luminosity, photospheric radius, Teff, Tc, $\rho_c$, size of the convective core, mass at which hydrogen has been depleted, and central hydrogen content as functions of time. The last plot is the theoretical H-R diagram, log L/Lsun versus Teff, during the evolution of the model.
We would like to thank Dr. Bohdan Paczynski for making his stellar evolution code available and Dr. Tim Pearson for making PGPLOT graphics subroutine library available.
References
Paczynski, B. 1970, Acta Astronomica V. 20, no. 2.